
To dodge traffic hotspots in Spain’s big cities, read real‑time flow data and incident feeds, then forecast surges from events and tourism. Focus on core spines and predictable corridors, and flex with nearby reversibles, bypass routes, and city‑specific detours when congestion spikes. Schedule departures to avoid peak windows, and adapt routes using live signals and delays. Build a proactive plan that accounts for parking, loading rules, and weather; more smart, linked steps await you if you keep exploring.
Key Takeaways
- Use real-time flow data and incident reports to identify bottlenecks and reroute before congestion builds.
- Schedule trips to avoid known surge windows from events, festivals, and peak commuter times.
- Prefer core routes for reliability; designate and test backup corridors to handle detours during incidents.
- Leverage reversible lanes, synchronized signals, and adaptive routing to maintain smooth traffic flow.
- Apply parking, loading, and curb-use rules to reduce dwell times and curb-side bottlenecks.
Why Traffic Hotspots Form in Spain’s Big Cities

In Spain’s big cities, hotspots form when traffic demand outpaces roadway capacity during peak periods, commuter surges, and events. You observe this through data dashboards that track turning movements, sensor counts, and incident reports, then map where bottlenecks emerge.
Peak inflows align with school starts, work commutes, and cultural festivals, revealing stress points along arterial corridors and perimeter routes.
Parking regulations influence behavior, creating spillover effects as drivers circle for spots, increasing dwell time and lane occupancy.
Effective hotspot prevention requires cross-functional coordination: transport planning, event management, and enforcement tighten capacity through adaptive signal timing, lane reallocation, and real-time messaging.
You should also consider multimodal options, congestion pricing signals, and targeted outreach to reduce nonessential trips during critical windows.
Reading Real-Time Traffic Like a Local
You can read the pulse of streets by watching real-time flow data and incident reports, then use that signal to adjust your route before congestion spikes.
Anticipate signals and flow by noting patterns—where delays cluster, where traffic eases, and how changes in one area ripple across the network.
This data-driven approach keeps you proactive and aligned with the city’s moving rhythm, not chasing it.
Read The Pulse Of Streets
Ever watched a city breathe in real time? You read the pulse by tracking indicators beyond signage: vehicle density, timing gaps, and flow mismatches. Start with live feeds: corridor speeds, intersection queues, and travel-time reliability between districts.
Compare weekdays versus weekends to spot persistent bottlenecks, then map them to demand drivers rather than blame the road. Expect local rhythms: school departures, market openings, and cultural festivals that redraw volumes.
Use dashboards to flag anomalies—sudden spurts, lingering backups, or outlier stops. Factor Parking regulations, noting where shifts in enforcement alter parking turnover and curb availability.
Translate signals into proactive detours, staged lane uses, and adjusted signal timing for resilience, ensuring predictable travel even as urban activities surge.
Anticipate Signals And Flow
Track patterns across intersections to anticipate bottlenecks, then adjust your route, speed, and spacing accordingly. This data-driven, proactive approach reduces stop-and-go, lowers fuel burn, and minimizes exposure to volatile traffic conditions.
Integrate Parking strategies by choosing curbside options near predictable destinations, then switch to nearby lots during peak windows. Regular Car maintenance guarantees consistent brake response and tire grip, preserving safety when flow shifts abruptly.
Core vs. Alternative Routes for Urban Trips
Core routes form the backbone of everyday urban trips, but alternative routes matter when congestion spikes or incidents disrupt our usual paths. You evaluate network resilience by comparing travel time variability, reliability, and incident recovery.
Using data, you map core corridors and potential detours, then test their performance during peak hours, local festivals, or public events. You also account for parking regulations that shift demand, nudging trips to buffers or off-peak windows.
Integrated planning reveals when switching routes reduces exposure to hotspots without increasing total distance. Your approach blends real-time signals with historical patterns, fostering proactive adjustments rather than reactive scrambles.
- Route-importance scoring across times of day
- Impact of events like Local festival on detour viability
- Parking regulations effects on spillover demand
- Reliability metrics for core vs. alternative paths
- System-wide mitigation strategies during incidents
Madrid Driving: Ring Roads and Center Bottlenecks
You’ll see how Ring Road efficiency shapes overall flow, with data showing how bottlenecks push volumes toward the center.
By mapping Center Bottleneck Shortcuts, you can spot where small route shifts yield large time savings and reduce gridlock.
We’ll look at Madrid Traffic Patterns to inform proactive choices and system-wide improvements.
Ring Road Efficiency
Madrid’s ring roads are a critical throughput layer, and their efficiency hinges on how well they balance inflow, exit, and linking arterials to the inner center. You optimize it by treating the ring as a dynamic system: monitor volumes, signal timing, and incident response to minimize spillback into radial corridors.
Use data-driven triggers to modulate lane usage, prioritize high-capacity segments, and coordinate with center bottleneck relief. Parking strategies and car maintenance subtly affect flow: parked cars block ramps, while well-maintained vehicles reduce unexpected stops.
Emphasize load balancing across hubs, emphasize real-time traveler information, and deploy adaptive routing that steers drivers away from congestion zones. Sustainable patterns emerge when you align infrastructure, behavior, and maintenance practices into a coherent, scalable approach.
- Monitor ring-arterial balance with real-time data
- Calibrate adaptive signals for peak windows
- Communicate dynamic routing to users
- Integrate parking strategies with ramp access
- Prioritize proactive maintenance and incident response
Center Bottleneck Shortcuts
Center bottlenecks drain throughput unless you route around them with precision. You’ll optimize Madrid driving by treating ring roads as dynamic conduits, not static lanes. Data shows that coordinated timing across entrances reduces queue spillovers into center bottlenecks, so synchronize signal priorities with ramp metering where available and favor stretches that bypass high-variance inflows.
Plan trips to align with off-peak windows, leveraging real-time occupancy data to choose routes that minimize merges and sudden braking. Incorporate parking regulations to discourage last‑mile circling near core zones, channeling short trips toward approved lots and drop-offs.
Promote carpool incentives to smooth demand, lowering peak-height traffic and freeing capacity for essential movements. Result: lower center-stage congestion, faster reliable travel, and more predictable city performance.
Madrid Traffic Patterns
Ring roads in Madrid act as dynamic arteries that shape citywide flow, not mere boundaries for the core. You’ll see that the M-30/M-40 rings direct traffic away from the center, while bottlenecks cluster around A-5 and A-6 interchanges during peak hours.
Data show timing shifts with workdays, affecting evening arrivals and weekend departures. By mapping inflows, you anticipate congestion hotspots and plan alternate routes or modal shifts.
Historical landmarks draw tourists into center corridors, compounding volume seasonally, and Local cuisine zones attract commuters at lunch—creating predictable surges.
Integrate signal timing, ramp meters, and bus priority to reduce spillback. You can balance cross-town trips with rail links, optimizing efficiency across the urban network.
- Ring-road dynamics and center bottlenecks
- Peak-hour shift patterns and seasonal spikes
- Landmarks and tourism-driven surges
- Local cuisine districts and midday flux
- Multi-modal coordination and timing optimization
Barcelona Driving: Timing the Eixample and Port Area
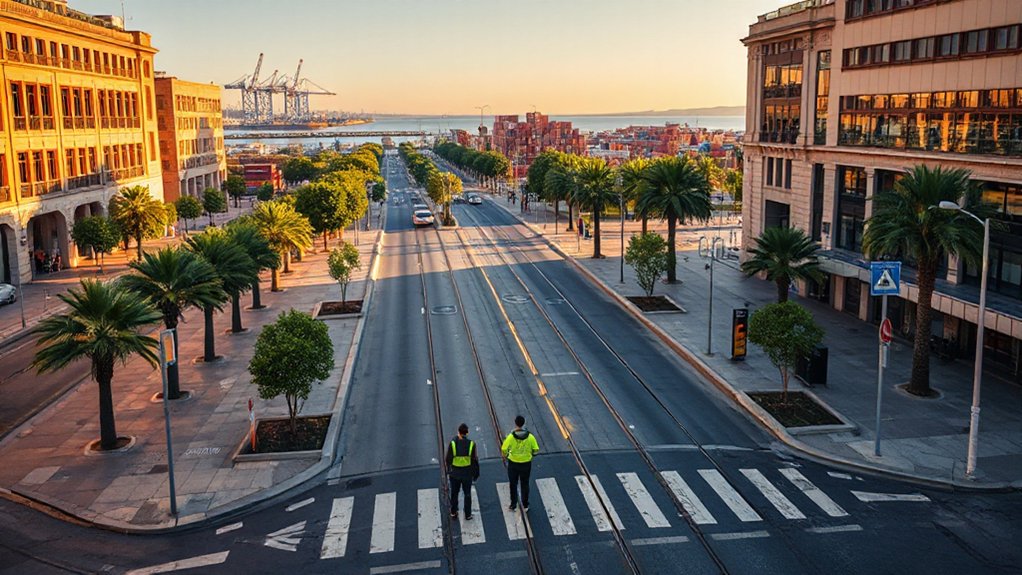
Traveling through the Eixample and Port Area requires timing that minimizes delays caused by one-way streets, loading zones, and frequent bike and pedestrian flows. You’ll optimize by aligning trips with lower traffic signals, predictable crossings, and curb-use patterns that shift with workdays and events.
Data shows morning influx concentrates near commercial cores; late afternoons see commuter spillover toward the beachfront. Map turn restrictions, then route to avoid repeated stops at congestion hotspots.
Proactive pacing reduces idling, improves energy use, and lowers exposure to erratic pedestrian flows. Monitor real-time lane closures and temporary bike lanes that alter typical paths.
Parking zones and toll stations influence detours; plan exits that minimize time spent searching for slots or paying tolls, preserving steady progress. Continuous feedback loops refine timing for ongoing hotspots.
Valencia Driving: Avoid the Turia Corridor Crush
Valencia drivers can sidestep the Turia Corridor crush by prioritizing routes that bypass peak crossing times and turbulence along the riverbank. You’ll rely on data-driven timing: monitor congestion indices, riverfront event calendars, and weather alerts to choose smoother corridors.
System-wide, optimize for predictable travel windows and minimize stop-and-go exposure near popular crossings. Focus on flow efficiency, not just shortest distance, and align with smart signal patterns where available.
Incorporate urban bike lanes and parking regulations to reduce car pressure along key stretch points, creating space for multimodal movement. Your approach should be proactive, with continuous reassessment as lanes are repurposed and closures occur.
- Time-window planning around Turia hotspots
- Alternate riverbank routes with lower volume
- Urban bike lanes integration for local trips
- Parking regulations to free curb space
- Real-time updates from traffic platforms
Seville Driving: Bypassing the Historic Center and Bridges
Seville’s historic center and its bridges can bottleneck quickly, so plan routes that bypass peak crossing times and known choke points by leveraging real-time congestion data, bridge load forecasts, and event calendars.
You should map alternate crossings on outer ring roads and use live updates to avoid Sudden closures or lane shifts near Puente de Isabel II and Puente del Alamillo.
Adopt a low-emission, predictable path that minimizes left turns through central arteries; favor arterials that feed toward the river outskirts during high-traffic windows.
Consider Parking regulations to prevent circling, and factor in toll systems on bypass routes where relevant to maintain ETA accuracy.
Combine scalable routing dashboards with proactive alerts for incidents, construction, and holiday crowds.
When to Drive: Peak Hours and Shoulder Windows
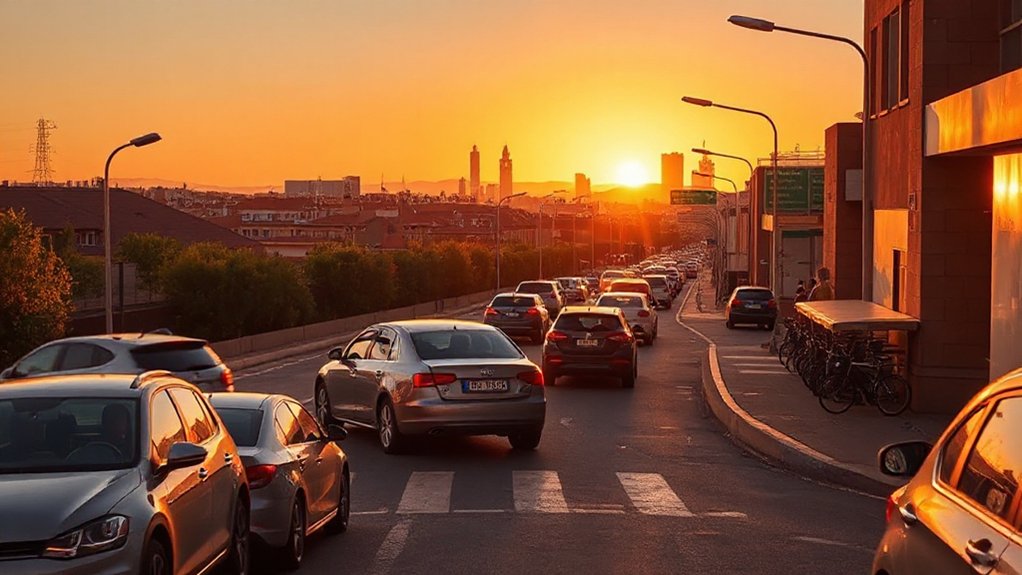
Peak hour patterns reveal when congestion spikes, so you can time trips to minimize delays.
Use shoulder windows—early starts or late arrivals—to exploit quieter periods and keep trips predictable.
We’ll align driving decisions with data on traffic density, road capacity, and incident likelihood to smooth your route planning.
Peak Hour Patterns
To minimize delays, you should target driving during off-peak and shoulder windows, when key corridors in major Spanish cities see the fastest travel times and the fewest incidents.
Peak hour patterns reveal predictable congestion on arterial routes and ring roads, with spillover effects from city centers. You can reduce exposure by aligning trips with measured transit data, real-time incident feeds, and historical flow dashboards.
Consider how parking regulations shape curb demand and affect lane utilization. Vehicle emissions policies also shift street performance, as cleaner fleets and congestion pricing alter trip composition.
By modeling these patterns, you anticipate bottlenecks, re-time legs, and smooth corridor performance.
- Map peak corridors by hour using regional speed dashboards
- Align trips with shoulder windows and predictable gaps
- Track incident-driven delays and alternative routes
- Evaluate Parking regulations impacts on curb capacity
- Monitor vehicle emissions incentives shaping travel choice
Shoulder Window Strategies
Shoulder windows matter because they represent the most reliable periods to travel with minimal friction across major Spanish corridors. You’ll optimize routes by aligning departures with transitional traffic phases, reducing stop-and-go and exposure to hotspots.
Analyze data on corridor throughput, incident frequencies, and signal timing to identify practical windows in each city’s outer rings. Implement a simple rule: move outside peak blocks, but inside known shoulder spans, to minimize delay risk.
Consider municipal parking regulations for curbside access during shoulder hours, ensuring your timing respects loading zones and resident permits. Track toll payment logistics to avoid speed reductions at gantries; prepay or use pass options where available.
Systems-thinking means continuously mapping evolving patterns and adjusting departure buffers to sustain smooth flow.
Using Public Transit to Hedge Traffic
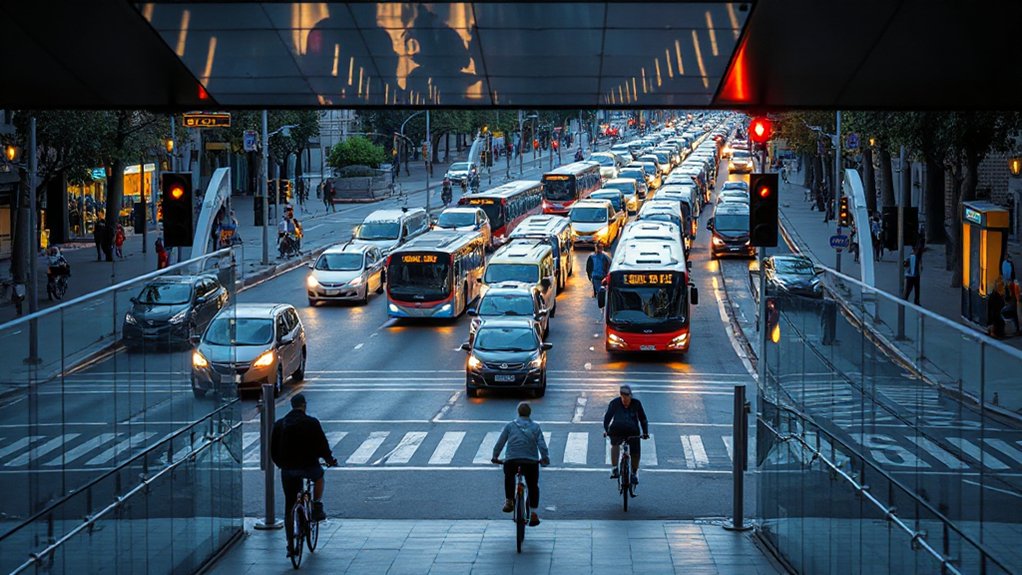
Public transit offers a reliable hedge against road congestion by shifting demand from overwhelmed arterials to dedicated networks. You benefit from predictable timetables, faster travel during peak windows, and reduced exposure to gridlock.
System-wide signals—frequency increases, off-peak incentives, and fare integration—guide travelers away from bottlenecks. Data show lower delays when modal shares rise in core corridors, especially where high-capacity lines intersect commuters’ destinations.
Parking regulations and pollution zones further incentivize mode shifts, limiting car access and improving overall flow. You’ll gain reliability, lower fuel costs, and fewer stop-start delays, while cities rebalance demand toward efficient transit spacing and enforcement.
A proactive use of transit also supports last-mile solutions and feeder networks that reduce car dependency and emissions.
- Optimize trip timing around service frequencies
- Leverage integrated tickets for seamless transfers
- Align work hours with peak-offpeak spreads
- Pair transit with micro-mobility for last mile
- Monitor real-time updates to avoid cascading delays
Local Routing Tricks by District (City-by-City)
Neighborhood-level routing changes in Madrid, Barcelona, Valencia, and Seville hinge on district-specific patterns and street-grid quirks. You’ll map high-variance corridors by district, prioritizing routes that minimize cross-town bottlenecks and leverage predictable flows around local landmarks and cultural events.
In Madrid, use Gran Vía and nearby squares to time reversals around peak theatre starts.
In Barcelona, exploit Eixample’s grid to bypass diagonal traffic during late-afternoon surges near Sagrada Família and the Gothic Quarter.
Valencia rewards you for linking Ruzafa with Alameda through secondary streets when the City of Arts and Sciences hosts crowds.
Seville benefits from routing that skirts the historic center during Semana Santa processions.
Across cities, maintain real-time feeds, validate with quickee-checks, and adapt plans before congestion forms.
Weather, Events, and Disruptions You Should Plan For
Weather-driven delays, major events shifts, and disruptions planning tips form a core input to your route choices.
By tracking real-time feeds and historical patterns, you’ll anticipate peak windows and reroute before congestion compounds.
This proactive, data-driven approach keeps your timing aligned with city-wide systems and reduces unexpected delays.
Weather-Driven Delays
- Link forecast alerts to your route choice
- Identify historically vulnerable corridors
- Schedule arrivals outside peak weather windows
- Use adaptive timing over fixed plans
- Maintain alternative modes as backups
Major Events Shifts
Major events and seasonal shifts reshape travel risk as much as weather does, so you should plan for both crowds and disruptions just as you plan for rain. You’ll map calendar-driven hotspots by analyzing past event density, transit usage, and crowd-flow data, then forecast near-term pressure points.
Cultural festivals concentrate foot traffic, street closures, and parking scarcity, while parade routes create temporary chokepoints that ripple outward to arterials and feeder lines. Integrate event schedules with real-time feeds from city transit, venue apps, and media alerts to anticipate incidents before they occur.
Build contingency buffers into your routes, favor secondary corridors, and stagger departures around peak windows. Communicate anticipated delays to travelers, enabling proactive pacing and safer, smoother journeys.
Disruptions Planning Tips
Disruptions come from multiple fronts—weather, events, and other incidents—so you should plan proactively rather than reactively. You’ll offset risk by modeling disruption probabilities, routing adjustments, and real-time data inputs.
Build contingency paths that minimize parking challenges and optimize toll navigation, then test them under scenarios. Align your plan with city advisories and event calendars to reduce exposure to spikes in congestion.
- Preload alternate routes around stadiums and convention centers
- Map parking garage caps and overflow lots for peak days
- Sync toll transponders with preferred corridors to avoid bottlenecks
- Subscribe to weather and traffic feeds for dynamic re-routing
- Create a drill for incidents near transit hubs and arterials
Practical Door-to-Door Timing Tweaks

Door-to-door timing tweaks aren’t about guesswork; they’re about aligning routes with real-time demand data to prevent buildup at hotspots. You monitor arrival patterns, segment trips by origin-destination pairs, and adapt dispatching windows to shifting demand.
Use dynamic sequencing: stagger departures, batch deliveries with similar routes, and adjust speeds to maintain steady flow rather than surge into congested corridors. Track KPIs such as on-time rate, dwell time, and cross-route interference, then recalibrate every hour.
Integrate parking strategies into the routing logic so curbside queues don’t derail progress. Prioritize systematic data checks—sensor fusion, GPS traces, and incident feeds—to detect anomalies early.
Maintain vehicle health with proactive car maintenance to sustain consistent performance and minimize avoidable delays. This approach lowers variability and keeps hotspots from forming.
Priority Lanes, Parking Zones, and Loading Rules
- Priority zones usage patterns
- Parking regulations enforcement windows
- Loading rules impact on dwell times
- Real-time constraint awareness
- Cross-district policy consistency
Fuel, Tolls, and Cost-Aware Routing
Focus on fuel management by selecting routes with smoother grades, ideal speeds, and fewer stops, reducing fuel burn per kilometer. Incorporate toll optimization strategies by comparing paid corridors against free alternatives and timing crossings to exploit off-peak tolls where feasible.
Use dynamic routing that weighs fuel costs, tolls, and time penalties, not just distance. Build a proactive feedback loop: log fuel receipts, monitor vehicle efficiency, and adjust plans after each trip.
This cost-conscious approach complements congestion relief, supporting predictable travel and urban air quality.
Tech Setup: Apps and Alerts to Dodge Hotspots
You’ll want real-time traffic signals, alert systems, and apps working in concert to flag hotspots before you hit them. This setup lets you compare live data streams and reroute with minimal friction, keeping your timing predictable.
Real-Time Traffic Signals
- Align cycle lengths with typical trip lengths to minimize stops
- Optimize offsets to create progressive movement along main streets
- Prioritize pedestrian crossing timing without compromising through-traffic flow
- Monitor real-time detector performance and recalibrate thresholds
- Validate gains with before-after traffic and emissions metrics
Alert Systems And Apps
Apps synthesize this input into clear, actionable guidance, showing alternate corridors, expected delays, and most effective departure times. You should consider factors like Parking regulations to avoid fines and toll systems that affect cost and flow on arterial routes.
Integrate alerts with your favorite navigation platform, and set thresholds for proactive rerouting. Regularly review historical heatmaps to adjust your routines seasonally.
This systems-thinking approach minimizes stop-and-go, improving reliability and fuel efficiency.
Neighborhood Quirks You Should Know (Madrid, Barcelona, Valencia, Seville)
Neighborhood quirks in Madrid, Barcelona, Valencia, and Seville aren’t random; they’re systematic patterns you can plan around. You’ll map how street grids, local parking, and neighborhood cafes shape flow, then align routes to minimize stops and delays.
Data-driven cues—timed markets, bus lanes, and permit zones—predict shifts in demand across hours, days, and neighborhoods. Use this to forecast hotspots before you travel, not after you encounter them.
- Local parking zones and hours you should monitor for wave effects
- Café traffic patterns as informal buffers or bottlenecks
- Market and siesta rhythms that affect curb activity
- Residential street rules that shift deliveries to off-peak windows
- Tram and bike lane usage overlapping with car routes
Apply these signals to your route planning for smoother navigation.
Emergency Detours: Fast Pivoting on the Fly
In fast-moving city traffic, detours aren’t a nuisance—they’re a data problem you solve in real time. You monitor live feeds, sensor delays, and incident reports to re-route before congestion compounds.
Pivoting on the fly means predefining fallback paths, not improvising chaos. You map corridors where urban art signals a shift in flow—murals or branding that attract pedestrians and slow vehicles—so you anticipate bottlenecks instead of chasing them.
Traffic psychology informs your choices: you favor routes that minimize cognitive load, reduce lane-switching, and preserve predictable travel times.
You test detour plausibility with probabilistic forecasts, adjusting for time of day and event-driven spikes. The goal is seamless continuity, not abrupt sprints.
Data-driven detours reinforce resilience, keeping you out of hotspots while preserving safety and efficiency.
Weekend and Night-Driving Shortcuts
When weekends and late nights shift traffic patterns, you lean on real-time data to carve smoother routes: lighter freight corridors, leisure-time corridors, and venue-driven surges mapped against historical trend lines.
You couple live feeds with predictive models to preempt bottlenecks, rerouting before congestion spikes. Your approach accounts for Parking enforcement and toll regulations, ensuring compliant, time-efficient paths without costly delays.
- Read live occupancy and event schedules to forecast pockets of congestion
- Prioritize routes with relaxed parking restrictions during late hours
- Cross-check toll regulations and dynamic pricing windows before departure
- Integrate GIS heatmaps to identify underutilized arterials
- Preload alternate corridors when anticipated surges exceed thresholds
City-by-City Case Studies: Effective Detours
Across Spain’s major metros, we translate real-time analytics into targeted detours by cataloging city-specific bottlenecks, road-use patterns, and event-driven surges.
In Barcelona, you reroute around Sagrada Família crowding and festival-induced gaps, leveraging pedestrian-first corridors to keep transit flowing.
Madrid shows how gridlocks near Puerta del Sol ease when you shift to arterial bypasses and synchronized signals, cutting delays by minutes.
Valencia’s port traffic and seaside events reveal predictable spikes; you leverage tunnel access and beach-side lanes before peak arrivals.
Seville’s tourist sweep around the cathedral and concerts requires pre-event timing windows and reversible lanes to maintain throughput.
You’ll appreciate how cultural landmarks and local cuisine cluster demand, guiding detour logic while preserving experience and efficiency.
Build Your Madrid-Barcelona-Valencia-Seville Route Plan
Craft a Madrid–Barcelona–Valencia–Seville route plan by stitching together city-specific bottlenecks, surge patterns, and detour equities into a single, coherent network. You’ll map peak windows, variable speeds, and alternate corridors, then align them with intercity connections to minimize overlap. Use real-time feeds and historical data to forecast hotspots, adjusting segments for reliability.
Prioritize routes that sustain steady flow near local cuisine stops and historical landmarks, so you can enjoy without pressure. Build redundancy into your plan: core spine, secondary legs, and safe fallback options. This systems view reduces risk, shortens travel time, and improves overall experience. Data-driven iteration keeps your plan resilient and adaptable across seasons and events.
- Identify core choke points and backup corridors
- Align departure windows with surge patterns
- Weave in cultural stop options around bottlenecks
- Feed live data for dynamic replanning
- Assess historical landmarks exposure and cuisine downtime
Frequently Asked Questions
How Do Weather Events Impact City Traffic in Spain’s Big Cities?
Weather events disrupt Spain’s big-city traffic by reducing visibility and road efficiency, causing slowdowns. You’ll notice weather disruptions strain traffic flow during rain, snow, or fog, prompting proactive adjustments, adaptive signaling, and smarter routing to maintain movement.
Which Apps Reliably Forecast Congestion 24 Hours Ahead?
Like a compass snapping to true north, you should rely on apps that provide real time alerts and historical data to forecast congestion 24 hours ahead, letting you plan proactively instead of reacting to fluctuating traffic patterns.
Do Weekend Traffic Patterns Differ by City Districts?
Yes, weekend congestion differs by district, with notable district variations in patterns. You should analyze historical data, compare boroughs, and adjust routes proactively, using real-time feeds to anticipate hotspots and optimize trips across the city.
How Can I Plan Flexible Detours During Events?
You can plan flexible detours by using dynamic route adjustments and real time traffic alerts, staying data-driven and proactive; you’ll reoptimize paths as events unfold, integrating predictive patterns, sensor feeds, and alternative corridors to minimize disruption.
What Are Common Parking-Related Delays to Avoid?
Parking congestion and parking enforcement drive delays, so you should scout alternatives, time selections, and permit rules; monitor real-time data, adjust routes, and park farther away when possible to minimize stoppages and maintain smooth, proactive flow.
Conclusion
You’ll love how predictable chaos becomes manageable. The data says hotspots shimmer at rushes, but your route plan can squash that glare with smart pivots, real-time reads, and a dash of urban systems thinking. So here’s the irony: the more you map backups, the fewer backups you chase. Drive like a strategist, not a gambler, and you’ll dodge bottlenecks you didn’t even know existed—until you do, and the city cooperates.